Top Machine Learning Experiment Tracking Tool

Developing a machine learning model is an iterative and never-ending process. Data scientists start with a base model and experiment with numerous architectures and data set versions to arrive at a model that they think will perform in production. More often than not, the performance in production data will not be at par compared to the testing data set and the model will undergo changes continuously. Even after the first model gets deployed, the iterative improvement process must go on to get the full benefit of a machine learning system. The models need to be monitored constantly and there must be auto-deployment mechanisms in place to facilitate quick model changes.
When it comes to experimenting with models, there are too many factors at play to keep track of everything mentally or use a project management tool. This is where machine learning experiment tracking tools help. The experiment management system
tools document the various parameters, dataset metadata, and model result metrics and make them available for analysis to improve the model further. If you are looking for a fully managed ML platform with bundled experiment tracking feature, consider QWAK. It can manage the full lifecycle of machine learning model development and take them to production at scale. This article is about the top ML experiment tracking tools available today.
What Is An ML Experiment Tracking Tool
Unlike traditional software development systems, machine learning systems are not white-box systems that provide predictable output in all cases? Most models are black boxes with limited explainability and exhibit significant behavioral changes even with small variations in hyperparameters or training data changes. Hence developing a machine-learning model requires a lot of research, experimentation, and patience. An ML experiment tracking tool helps to manage all the activities related to experiment runs and streamlines the research process.
Model Metadata Storage
Machine learning engineers try out a large number of architectures and their variations before arriving at the final one. Even after finalizing the architecture, they tune numerous parameters to get the best performance possible. These parameters vary according to architecture, performance requirements, and input data. Models exhibit large variations even for small changes in these parameters. ML Experiment tracking tools store all the information related to training runs in a searchable form.
Data Version Storage
Model behavior changes a lot when the training data changes. In most machine learning projects, a large percentage of the total project execution time is spent on cleaning data and creating refined versions of training data. It is impossible to recreate a model without having access to the exact training data it was exposed to. ML Experiment tracking tools store the data version information for all the experiments.
Model Result Metrics Storage
The results from each variation of the model architecture or hyperparameters provide insights into how the model behavior changed when the parameters changed. This provides valuable information for designing the next experiments. ML tracking tools store the model result metrics and help data scientists to correlate the changes in results with the changes they made.
Baselines and Comparison
Deciding which model is best for a use case is a tedious task when you have a number of models exhibiting slight variations in results in the same test data. ML Engineers establish baselines for model accuracy and data versions before they change parameters and rerun experiments. ML tracking tools store these baseline values and compare the results against these baselines. This helps ML engineers to decide which model performs better and in what situations.
User Interface For Result Investigation
ML Tracking tools provide intuitive dashboards to help ML engineers investigate model behavior. It helps to understand slices of data where results is not great and drill down into the test data set to understand what went wrong. This provides valuable information to design new data sets and model variations. ML Tracking tools also provide the option to define custom reports based on custom metrics.
Need For An ML Tracking Tool
Research-Oriented Style Of Working
Machine learning model development involves a research-oriented working style based on well-defined experiments. Since most models are black boxes, the engineers may not have enough information on how the model behavior will change when they vary the model parameters. Hence ML engineers often make slight changes to various parameters and observe the model behavior to arrive at the correct architecture. The input configuration and output metrics from the previous experiment become the foundation for designing the next experiment. A tool that can keep track of all the configurations used in an experiment is a great help during such styles of development.
Far Too Many Variables
There are numerous variables that can affect the performance of a machine-learning model. The primary factor is the input data set. The majority of the effort that goes into developing a model is spent on refining data sets. Then there are the hyperparameters which depend on the model architecture. Even the framework on which the model is implemented affects the results. It is common to see models designed based on the same architecture providing different results when implemented using different deep learning frameworks. A tool to keep track of all such variables is a must-have if you want to follow a systematic working style.
Collaborative Development
Since model development requires numerous experiments that are often time-consuming, most ML Engineering teams run these in parallel. Hence a number of engineers will be working on the same problem, often executing experiments with slight variations. Without a system to track the individual experiments and document the results, it s difficult for engineers to continue experiments initiated or designed by other engineers.
How to Choose the Right ML Experiment Tracking Tool?
Architects must consider several factors before choosing the ML experiment tracking tool. While most ML tracking tools offer basic features like parameter logging and metrics aggregation, considerations such as implementation methodology, ease of integration, and visualization features vary a lot from each other. Some of the most important factors to consider while choosing an ML experiment tracking tool are listed below.
What Needs To Be Tracked?
An understanding of what details to track in each experiment is the primary factor when choosing a tool. While most requirements will require model hyper-parameters and result aggregation, some may even want to track the CPU usage and memory footprint.
Data Version Support
An ideal tool must provide features to track different versions of data and how the changes in training data affect performance. Some tracking tools also can do a bit of what-of analysis and provide basic explanations about your trained model.
Integration With Your Frameworks and Systems
Machine learning is a fast-evolving domain and there are numerous machine learning frameworks and cloud frameworks to choose from at any point in time. The point of choosing your tracking tool may be a good time to standardize the libraries and frameworks that you use for experiments. Some of the tools work better with specific frameworks and cloud services.
Web UI vs Console Based
Your organization’s style of working and the preference of engineers play a big role in choosing between a code-based tracking tool vs UI based one. UI-based ones that follow a minimum code approach are easier to integrate but may also lose out on flexibility offered by the code-based integrations.
Server Based vs Managed
ML platforms are available as completely managed services with all the required features like experiment tracking, deployment, etc. The managed services spare you the effort in dealing with infrastructure and setup. If you are looking for a completely managed ML platform, consider Qwak.
Model Comparision Support
Comparing models across experiments and making decisions based on performance on slices of data fragments is an integral part of an ML engineer’s job. Hence, a tracking tool with the model comparison feature can reduce your time to market.
Drilling Through Experiment Data
Exposing the logged data in an easily understandable and searchable form is very critical in the case of ML experiment management system. A searchable database of experiment results helps in quickly formulating the next experiments.
Customization
Most ML requirements deal with custom metrics to assert the performance of their models against specific use cases. Your tracking tool must have the option to define custom metrics and visualize results based on these.
Collaboration Features
A good ML tracking tool must have access control and collaboration features built in. Running parallel experiments, sharing with the team, and making quick decisions about the next experiment is the way of working in the ML development lifecycle.
How to Use an ML Experiment Tracking Tool?
ML experiment tools typically contain two parts:
- A client SDK or snippet that developers can integrate with their training code
- A dashboard and visualization service that provides analysis features.
Using an ML experiment tracking tool involves the below steps.
Logging
This involves integrating the client code into your training modules and defining the metrics that need to be captured.
Interpret
After the experiment run, engineers head to the dashboard to understand the results of their experiments and compare them with the previous runs. The tracking tools provide an easily searchable interface and trend visualizations to aid this.
Experiment
Based on the information gathered from the interpretation of results, ML engineers define new experiments considering their accuracy targets and use cases. The teams log experiment parameters in the tracking tool and initiate the next experiment. This cycle repeats for the lifetime of the model.
Top ML Experiment Tracking Tools
Verta.ai
Verta is an ML platform that can handle all activities in the machine-learning model lifecycle. It can help in managing models, deploying, operating, and monitoring models. Verta is available as a completely managed offering or as a deployable to your on-premise or private cloud. The experiment tracking feature in Verta helps in model metadata storage, dataset versioning, and ensuring model reproducibility.
Verta groups the activities in the ML lifecycle into projects, experiments, and experiment runs. Verta groups the logged information into attributes, hyper-parameters, metrics, observation, and metadata. Attributes are key-value pairs meant to log features and input data information. Metrics are measurements that are logged for a full training run. Observations are recurring measurements that change over time during a single run itself. Verta has an intuitive dashboard that enables collaboration through sharing and in-line comments.
Verta offers numerous features other than experiment tracking. It has a model registry where organizations can maintain model assets. The model registry supports the typical workflow of releasing a model with staging, approval, and release modes. Verta can integrate with CI/CD tools like Jenkins. It can quickly package your models and deploy them as services. It can watch out for model-related issues like data drift, concept drift, etc. Verta supports all the common open-source machine learning frameworks like Tensorflow, Pytorch, SKlearn, etc. It can also work with AWS, GCP, and Azure-managed machine learning services.
DVC
DVC is an open-source machine learning platform that includes machine learning project version control, experiment management, deployment, and collaboration. DVC can track data set versions and model versions through a command structure emulated on Git version control. DVC consists of many tools that fit into various sections of machine learning model lifecycle management. DVC Live is a set of libraries for logging information during training and inference. DVC Studio is a visual interface where the logged information and the management information can be viewed and tinkered with.
DVC Data management deals exclusively with model and data version management. The data management layer has a cache layer that facilitates the quick transfer of data assets across teams. It can integrate with popular CI/CD tools and push models from the built-in model registry to production.
DVC Experiment management module deals with string experiment metadata and visualizes it. The experiments are managed using a GIT-like command line interface. DVC follows a code-based approach and provides commands for comparing experiments and persisting them. The visualization module supports all the basic machine learning accuracy-related plots based on confusion matrix and error values. DVC Live can auto-generate model training metrics such as epoch losses by integrating with popular machine learning libraries and sending them to the visualization module.
SageMaker
Sagemaker is a machine learning platform provided as a completely managed service by Amazon Web Services. Sagemaker is envisioned as a complete ML platform that can manage experiments, automate hyper-parameter tuning, register models, store models and deploy them as APIs. Sagemaker benefits from its tight integration with Amazon’s completely managed infrastructure. Sagemaker has built-in data processing capabilities that allow developers to execute the data preprocessing step with the ML platform. It has a built-in feature and can detect data anomalies and drifts within the feature store through advanced algorithms. The ‘clarify’ model feature from Sagemaker provides explanations about model output.
Sagemaker’s experiment plugin helps ML engineers to log metrics, model metadata, and hyper-parameters through a few lines of Python code that can be integrated with the Python module. The experiment runs can be created through the Python API, SDK, or using a visual interface. The runs are grouped to run groups based on a common objective. The data captured from experiments can be visualized within Sagemaker Studio. It is known for its rich visualization features such as scatter plots, histograms, bar charts, etc. The data can also be loaded into independent notebooks for further analysis through the python code itself. Sagemaker studio provides search features to analyze the results of the experiment.
Weights & Biases
Weights And Biases or WandB is a developer-first MLOps platform with support for experiment tracking, dataset versioning, and model management. It can be used as a completely managed cloud service or installed in your private infrastructure. WandB boasts of the ability to integrate with any training or inference module in just 5 lines of code. It supports all the well-known machine learning frameworks such as Pytorch, Tensorflow, Huggingface, etc. WandB can track model and dataset versions across experiments and store the results in a centralized model repository. It supports automated hyperparameter tuning. There is a dashboard with collaborative features such as comments and conversation threads. The dashboard also helps MLEngineers debug model issues through it interactive visualization.
The experiment tracking feature helps to stream training metadata to the dashboard and visualize it live. It can keep track of hyperparameters for each experiment and document the hardware usage. Data points like CPU and GPU usage, network usage, etc are logged automatically. Other parameters like gradients, losses, etc need to be logged manually. WandB can not automatically integrate and capture training-related metrics. Like other ML experiment tracking tools, WandB groups experiments into projects. Each project has a dashboard page where developers can compare results from different runs. The data set versioning feature helps deduplicate data automatically.
Neptune
Unlike the other tools mentioned so far, Neptune AI is a pure experiment tracking tool and does not try to become a complete ML platform. It focuses on experiment management and can track the model versions. There is a built-in model registry. Neptune AI is available as an on-premise installation, a private cloud-based installation, or as a completely managed service. Neptune organizes projects into workspaces. Teams can create experiments inside a project and visualize them in the dashboard on a project and experiment level. Neptune’s pricing starts at 150$ per month for cloud-based offerings. In case you want to install it in your server or a cloud server, you have to shell out 600/month.
When it comes to experimenting with tracking, Neptune provides an SDK and Python API just like other tools. The SDK can log metrics automatically in the case of supported libraries. Most of the well-known libraries like Tensorflow and Pytorch are supported. In case you are working with a nonsupported library, you can manually log information from the training code. Neptune does not have data version tracking ability but can integrate with DVC to provide this functionality. Neptune provides the ability to create custom dashboards by choosing the metrics you focus on. It exposes all the metadata it captured through the Query API. This is useful if you want to integrate Neptune to another in-house tool.
Sacred + Omniboard
Sacred is an open-source Python-based tool for tracking experiments. It is meant to be an experiment tracking only and does not try to be a complete ML platform. Sacred only focuses on logging information about your machine-learning experiments and does not provide a built-in dashboard. it uses the concept of observers to automatically capture information about your experiments. There are open-source projects such as Omniboard and Sacredboard that provides the visualization feature for data logged using Sacred. Scared and Omniboard is a widely used combination. Since all the components here are open source, there is no pricing involved. Sacred prefer MongoDB as the metadata store. Scared has an automatic seeding feature that ensures repeatable results while training.
Omniboard is a web dashboard designed specifically for Sacred experiment tracking. It connects to the MongoDB instance where Sacred stores its information. Omniboards lists all the experiment runs in a tabular format with the flexibility to add columns based on metrics. Omniboards shows plots based on various metrics. It can also show the console output of the training run and refresh it periodically without user input. Data assets related to experiments can be downloaded from the dashboard. It can plot results from multiple experiments in a single plot and compare them. Both Sacred and Omniboard are distributed based on the MIT license.
Comet
Comet is a complete ML platform that is available as a completely managed service or an on-premise deployable. Comet can manage the full lifecycle of your machine-learning journey. It can track the data version changes with lineage documentation. It can also track model changes. Comet UI provides automatic and dynamic reporting for experiments, models, and production operations. Comet UI organizes experiments into organizations, projects,s and workspaces. Since it exposes the APIs for the UI, engineers can build a custom user interface if they are not happy with the original visualization. Comet can be used free of cost if you want to deploy it on your own server. For managed services, pricing starts at 50$ per user per month.
Tracking an experiment using Comet can be done by integrating a few lines of code. Comet supports automatic logging for common machine learning frameworks - Tensorflow, Pytorch, Scikit Learn, and Huggingface. For other frameworks, you need to log in manually. On a high level, auto-logging captures steps, metrics, hardware usage, model graph representation, and hyperparameters. The exact parameters that are captured during auto-logging vary with the framework. Comet provides an API that can be used to fetch the data logged using Comet. This is useful when developers want to create custom dashboards or analyze data using code.
MLFlow
MLFlow is an open-source platform to handle the complete model development lifecycle. It can run with any machine learning library and be deployed in any cloud environment. MLflow comes with built-in spark support. This helps in executing the data engineering part of your model from within the machine learning platform itself. MLFlow contains four modules - Tracking, Projects, Models, and Model Registry. The tracking module deals with experiment tracking and storing the metadata associated with it. The projects module helps with packaging reusable operational code and the models module help in packaging models as API. The model registry stores the models and enables the lifecycle management of models. Since it is open source, there is no pricing involved.
MLFlow tracking represents experiments as runs. Each run captures a set of basic information such as code version, start time, end time, parameters, metrics, and artifacts. Runs are grouped as experiments. These details are recorded in local files, an SQL-compatible database, an MLFlow remote tracking server, or a data bricks workspace. MLFlow supports automatic logging for metrics in the case of supported frameworks. Most of the popular ones like Tensorflow, Pytorch, FastAI, LightGBM, etc are supported. For the non-supported libraries, developers can use integrate the tracking code into training modules and log any information through a few lines of code. MLFlow tracking UI helps developers to investigate the results and compare them.
TensorBoard
TensorBoard is an experiment tracking and visualization tool kit provided as part of the Tensorflow framework by Google. Tensorboard provides a UI for visualizing the metrics and loss values along with the hyperparameters for the models. Tensorboard focuses only on the metric capture and visualization part. It can display histograms of weights, biases, or any other metric that changes over time. It does not have a built-in model registry or data version control. Tensorboard can visualize the model graph and project embeddings in case of lower dimensional data. Tensorboard can profile TensorFlow-based programs and display text or image-based input and output data. Tensorboard is open-source and free to use.
Since Tensorboard is primarily designed for Tensorflow it does not do a good job of integrating with other machine learning frameworks. Pytorch has support for integration with Tensorboard. Other popular ones like Sci-kit learn do not have integration support. Even though it does not explicitly support data version, developers can always manually log this information as an attribute from their training code and Tensorboard will display it just like any attribute. One can also Tensorboard as a user interfaces with other logging frameworks that support automatic logging. But if you are exclusively working with Tensorflow, this is all you need for basic experiment tracking.
Polyaxon
Polyaxon is an open-source ML Operation and Infrastructure Platform. It is available as a completely managed service or as an on-premise deployable. It supports tracking, orchestration, model management, data versioning, and a built-in model registry. Polyaxon supports TensorFlow, Keras, scikit learn, Mxnet, and Caffe. It has an automatic optimization feature that compares model runs and suggests the best model. It can also do automated search runs for finding the best combination of hyper-parameters. It supports all the cloud providers as runtimes for your model training runs and deployment target. Polyaxon provides an enterprise version that can be deployed on-premise with premium support. The pricing starts at 450$ per month for the cloud version and 3500 per month for the enterprise version with premium support.
Polyaxon tracking can automatically log key metrics while working with the supported frameworks. Integrating it into nonsupported frameworks can be done using a few lines of code. The dashboard lets developers compare runs. It also provides a query language to search deeper using code. It can integrate with third-party visualization tools like Tensorboard. It has a built-in workflow automation module that helps developers to define their data flows prior to model inference and after that. Other than the dashboard Polyaxon provides two more UIs. The project management UI helps to manage project access and grouping runs logically. The organization management UI helps to manage team access and set permissions.
Pachyderm
Pachyderm specializes in data-driven machine learning pipelines. It has a community version that users can download and install. The pricing for the enterprise version is not public. Pachyderm can automate data deduplication, manage data versions and schedule training runs automatically when the data changes. It does not support a feature store or a serving engine. It does not support monitoring either. Pachyderm focuses specifically on data management around MLOps. Being a data-focused platform, it integrates seamlessly with data warehouses like Snowflake and Redshift. Experiment tracking is an additional feature and is not a complete offering like the others in this list.
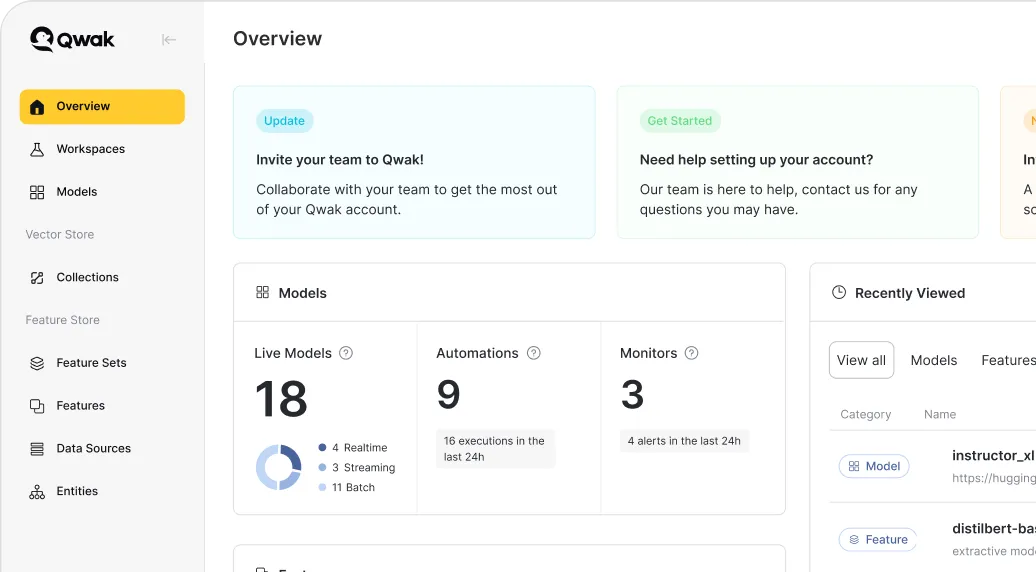
Qwak
Qwak is a fully managed MLOps tool that supports all activities of the machine learning model development lifecycle. It can help one transform and store data, train, deploy and monitor models. Qwak can help to track experiments and promote the best model among the results to production. Qwak has a built in feature store. It also supports automated monitoring.
Conclusion
Machine learning experiment tracking is a complicated process because of the number of variables involved. A model’s result is influenced by the data it sees, the hyper parameters that were used during the training,, or even the seeding approach used for random variable initialization. The model development lifecycle is a never-ending iterative process that takes input from all the previous experiments to form the next experiment. Hence a platform that is tailor-made for tracking experiments is a great tool to accelerate the development process. ML Tracking tools store metadata regarding your models, data versions, output results and metrics. They provide search interfaces to quickly run through hundreds of experiments and investigate systematically.
If you are looking for a completely managed ML platform with built-in experiment tracking, consider Qwak.
Qwak simplifies the productionization of machine learning models at scale. Qwak’s Feature Store and ML Platform empower data science and ML engineering teams to Build, Train and Deploy ML models to production continuously. By abstracting the complexities of model deployment, integration, and optimization, Qwak brings agility and high velocity to all ML initiatives designed to transform business, innovate, and create a competitive advantage.
Say goodbye to complex AI/ML
Chat with us to see the platform live and discover how we can help simplify your AI/ML journey.